library(tidyverse) # overall grammar
library(tidytext)  # only for reorder_within & scale_y_reordered functions
library(scales)    # only for percent function
library(httr2)     # for making http requests
library(rvest)     # for web scraping function
library(robotstxt) # only for paths_allowed functionScraping ESG Data from Yahoo Finance
R
Data
How to scrape environmental, social and governance risk scores using R
In this post, I provide a simple approach to scrape Environmental, Social and Governance (ESG) information from Yahoo Finance (e.g., Apple) using the programming language R. Yahoo Finance provides total ESG scores, environment, social and governance risk scores, as well as controversy levels, all compiled by Sustainalytics (which is by now owned by Morningstar). My code builds on the walk-through by Kyle Ruden, which I adapted to the current page structure of Yahoo Finance and my own coding style. In addition, I added a few steps that I, as web scraping newbie, had to look up while going through his guide.
To begin with, I want to urge you to read at least the legal and ethical considerations put forward by Kyle. Most importantly, I want to mention that, when performing web scraping tasks, it is both good practice and often required to set a custom user agent request header to identify yourself, as well as sending requests at a modest rate to ‘smell like a human’. I consider both of these key aspects in my code below.
Throughout this post, I rely on the following packages:
Get Symbols
First, we want to get some companies for which we want to scrap ESG information from Yahoo Finance. Let us get a table of symbols and industry information of the S&P 500 constituents from Wikipedia. The function read_html normalizes the page to a valid XML document. html_nodes then allows us to point exactly to the table we can find on the website using the name of the CSS node. html_table then parses the HTML table into a data frame. Note that, as one of the last steps, we need to replace all dots in the symbols with dashes to get the symbols used by Yahoo Finance.
wikipedia_link <- "https://en.wikipedia.org/wiki/List_of_S%26P_500_companies"

symbols <- read_html(wikipedia_link) |>
  html_nodes(css = "table[id='constituents']") |>
  html_table()

symbols <- symbols[[1]] |>
  select(symbol = Symbol,
         company = Security,
         sector = `GICS Sector`,
         industry = `GICS Sub-Industry`) |>
  mutate(symbol = str_replace(symbol, "[.]", "-")) |>
  arrange(symbol)
The following chunk prints what we got from Wikipedia. We will use the sector information in the last section of this post where we take a quick look at the scraped data.
symbols# A tibble: 503 × 4
symbol company sector industry
<chr> <chr> <chr> <chr>
1 A Agilent Technologies Health Care Life Sciences Tools & …
2 AAL American Airlines Group Industrials Passenger Airlines
3 AAPL Apple Inc. Information Technology Technology Hardware, S…
4 ABBV AbbVie Health Care Biotechnology
5 ABNB Airbnb Consumer Discretionary Hotels, Resorts & Crui…
6 ABT Abbott Health Care Health Care Equipment
7 ACGL Arch Capital Group Financials Property & Casualty In…
8 ACN Accenture Information Technology IT Consulting & Other …
9 ADBE Adobe Inc. Information Technology Application Software
10 ADI Analog Devices Information Technology Semiconductors
# ℹ 493 more rowsLocate ESG Information
The point where I struggled when I tried to replicate other guides was the search for the exact location of the information that I want to scrape (and the fact that the old locations seemed to have changed). After some trial and error, it turns out that it is really easy. Once you download a web page, you can in principle either use CSS nodes or XML paths to extract information using html_nodes() as above. However, the CSS nodes on Yahoo Finance have a weird structure that is apparently not straight-forward to use in this function. Fortunately, XML paths work perfectly! Google will explain to you what these terms mean, I only demonstrate how you find the relevant paths which we use in the scraping function below.
Let us stick to Apple as our main example and go to the sustainability tab on Yahoo Finance. If we right-click on the ESG score (e.g., using Google Chrome), we can see the the option to ‘Inspect’.
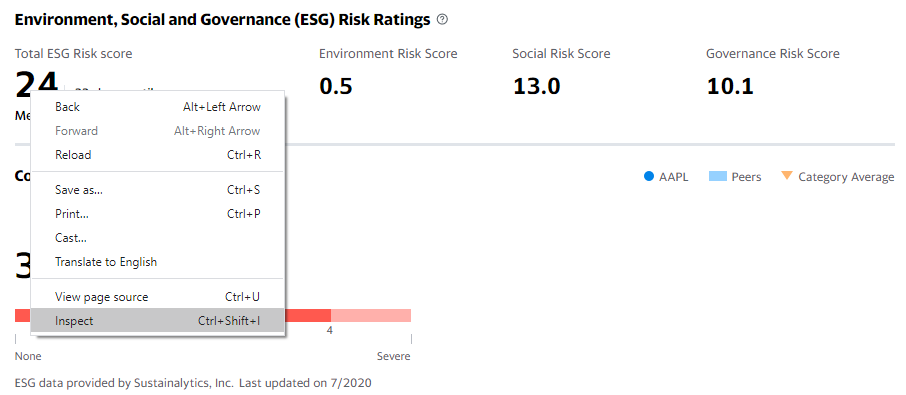
Once you click on it, a tab to the right opens where you see the underlying code. What is even more useful is the fact that the browser highlights the corresponding elements on the website as you hover over the code. This way, it is really easy to locate the information we are after. So we click on the relevant element and we copy the XML path.
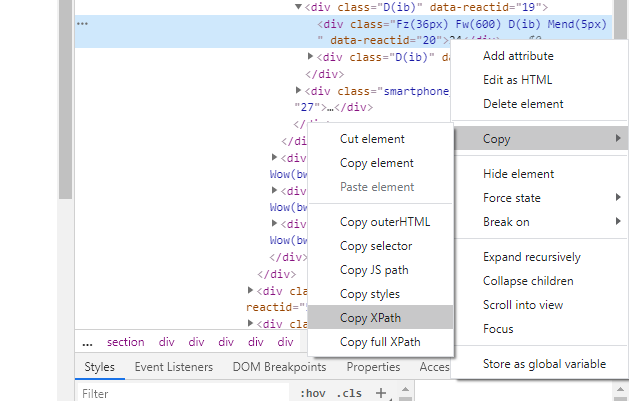
So the location of the total ESG score on the page is: '//*[@id="Col1-0-Sustainability-Proxy"]/section/div[1]/div/div[1]/div/div[2]/div[1]'
We can just point-and-click on all the items we want to scrap and collect the relevant XML paths. Once we downloaded a page, we just tell html_node() where to look for the information we want and afterwards how to parse it.
Define Functions for Scraping
My function to scrap ESG data takes two main inputs: the stock symbol and your user agent. We got the symbols from Wikipedia, but we need to define our own user agent. For instance, I use an agent that looks like this:
agent <- "Your Name ([email protected]). Doing personal research."The main functions then proceeds as follows:
- Construct the link of the page we want to download.
- Check if scraping is allowed.
- Download the page.
- Extract individual information using the XML paths we manually extracted following the point-and-click procedure from above.
- Collect all information in a table.
Let us start with a function that scrapes a page for a specific symbol:
scrape_sustainability_page <- function(symbol, agent, max_tries = 10) {
  link <- paste0(
    "https://finance.yahoo.com/quote/", symbol, "/sustainability?p=", symbol
  )

  check <- suppressMessages(robotstxt::paths_allowed(link))

  if (check == TRUE) {
    resp <- request(link) |>
      req_user_agent(agent) |>
      req_retry(max_tries = max_tries) |>
      req_perform()

    page <- resp$body |>
      read_html()

    return(page)
  } else {
    stop(paste0("No bots allowed on page '", link ,"'!"))
  }
}
The second function extracts the relevant information from the scraped pages and returns it as a table.
extract_esg_data <- function(symbol, page) {
  scrape_date <- Sys.time()

  total_esg_score <- page|>
    html_node(xpath = '//*[@id="Col1-0-Sustainability-Proxy"]/section/div[1]/div/div[1]/div/div[2]/div[1]')|>
    html_text()|>
    parse_number()

  total_esg_percentile <- page|>
    html_node(xpath = '//*[@id="Col1-0-Sustainability-Proxy"]/section/div[1]/div/div[1]/div/div[2]/div[2]/span')|>
    html_text()|>
    parse_number()

  environment_risk_score <- page|>
    html_node(xpath = '//*[@id="Col1-0-Sustainability-Proxy"]/section/div[1]/div/div[2]/div/div[2]/div[1]')|>
    html_text()|>
    parse_number()

  social_risk_score <- page|>
    html_node(xpath = '//*[@id="Col1-0-Sustainability-Proxy"]/section/div[1]/div/div[3]/div/div[2]/div[1]')|>
    html_text()|>
    parse_number()

  governance_risk_score <- page|>
    html_node(xpath = '//*[@id="Col1-0-Sustainability-Proxy"]/section/div[1]/div/div[4]/div/div[2]/div[1]')|>
    html_text()|>
    parse_number()

  controversy_level <- page|>
    html_node(xpath = '//*[@id="Col1-0-Sustainability-Proxy"]/section/div[2]/div[2]/div/div/div/div[1]/div')|>
    html_text()|>
    parse_number()

  last_update_date <- page|>
    html_node(xpath = '//*[@id="Col1-0-Sustainability-Proxy"]/section/div[3]/span[2]/span')|>
    html_text()

  last_update_date <- str_remove(last_update_date, "Last updated on ")

  tibble(
    symbol,
    scrape_date,
    total_esg_score,
    environment_risk_score,
    social_risk_score,
    governance_risk_score,
    controversy_level,
    last_update_date
  )
}
Scrape ESG Data
Now, let us put everything together: we loop over all symbols to download the relevant pages and extract the relevant ESG data. I store each instance of esg_data because the scraping process is very likely to be interrupted by Yahoo Finance as it starts to block requests after some time. By using a loop, I can interrupt the execution any time and continue with the last index.
for (j in 1:nrow(symbols)) {
  page <- scrape_sustainability_page(symbols$symbol[j], agent)
  esg_data <- extract_esg_data(symbols$symbol[j], page)
  write_rds(esg_data, paste0("data/esg_data_", symbols$symbol[j], ".rds"))
}

esg_data <- list.files("data/", full.names = TRUE) |>
  map_df(read_rds)
The code chunk from above takes a couple of hours in the current specification because of the increasing waiting times. The whole table then looks like this and also includes our initial example Apple:
esg_data # A tibble: 503 × 8
symbol scrape_date total_esg_score environment_risk_score
<chr> <dttm> <dbl> <dbl>
1 A 2023-11-27 00:29:33 15 0.3
2 AAL 2023-11-27 00:29:33 29 11.5
3 AAPL 2023-11-27 00:29:35 17 0.6
4 ABBV 2023-11-27 00:29:37 28 1.1
5 ABNB 2023-11-27 00:29:38 NA NA
6 ABT 2023-11-27 00:29:39 25 3
7 ACGL 2023-11-27 00:29:39 21 1.5
8 ACN 2023-11-27 00:29:40 10 0.3
9 ADBE 2023-11-27 00:29:41 12 1.9
10 ADI 2023-11-27 00:29:41 24 10.1
# ℹ 493 more rows
# ℹ 4 more variables: social_risk_score <dbl>, governance_risk_score <dbl>,
# controversy_level <dbl>, last_update_date <chr>Quick Evaluation of ESG Scores
Let us take a quick look at the data we collected. First, let us check the overall coverage of our sample:
scales::percent(nrow(na.omit(esg_data)) / nrow(esg_data))[1] "86%"This is not too bad. I believe that for most of the companies without ESG scores in my sample, Yahoo Finance does not provide any data. Admittedly, I should check manually at some point, but for the purpose of this post, this is definitely a success. To analyze sector-level breakdowns, I construct a summary table which I use as the main source for the following figures.
esg_scores_sector <- symbols |>
  left_join(esg_data, join_by(symbol)) |>
  group_by(sector)|>
  summarize(companies = n(),
            coverage = sum(!is.na(total_esg_score)) / n(),
            across(c(contains("score"), controversy_level),
                   ~mean(., na.rm = TRUE)))|>
  arrange(-coverage)
The first figure gives us the coverage per sector. All real estate companies have ESG scores, while only a bit more than three quarters of communication services feature this information.
esg_scores_sector|>
  mutate(labels = paste0(companies * coverage, " out of ", companies))|>
  ggplot(aes(y = reorder(sector, coverage),
             x = coverage, fill = factor(round(coverage, 0)))) +
  geom_col(show.legend = FALSE) +
  theme_minimal() +
  geom_text(aes(label = labels), hjust = 1.1, color = "white") +
  coord_cartesian(xlim = c(0, 1)) +
  scale_x_continuous(labels = scales::percent) +
  labs(x = NULL, y = NULL,
       title = "Number of companies with ESG scores per sector",
       subtitle = "Based on Yahoo Finance and S&P 500 data as of November 2023")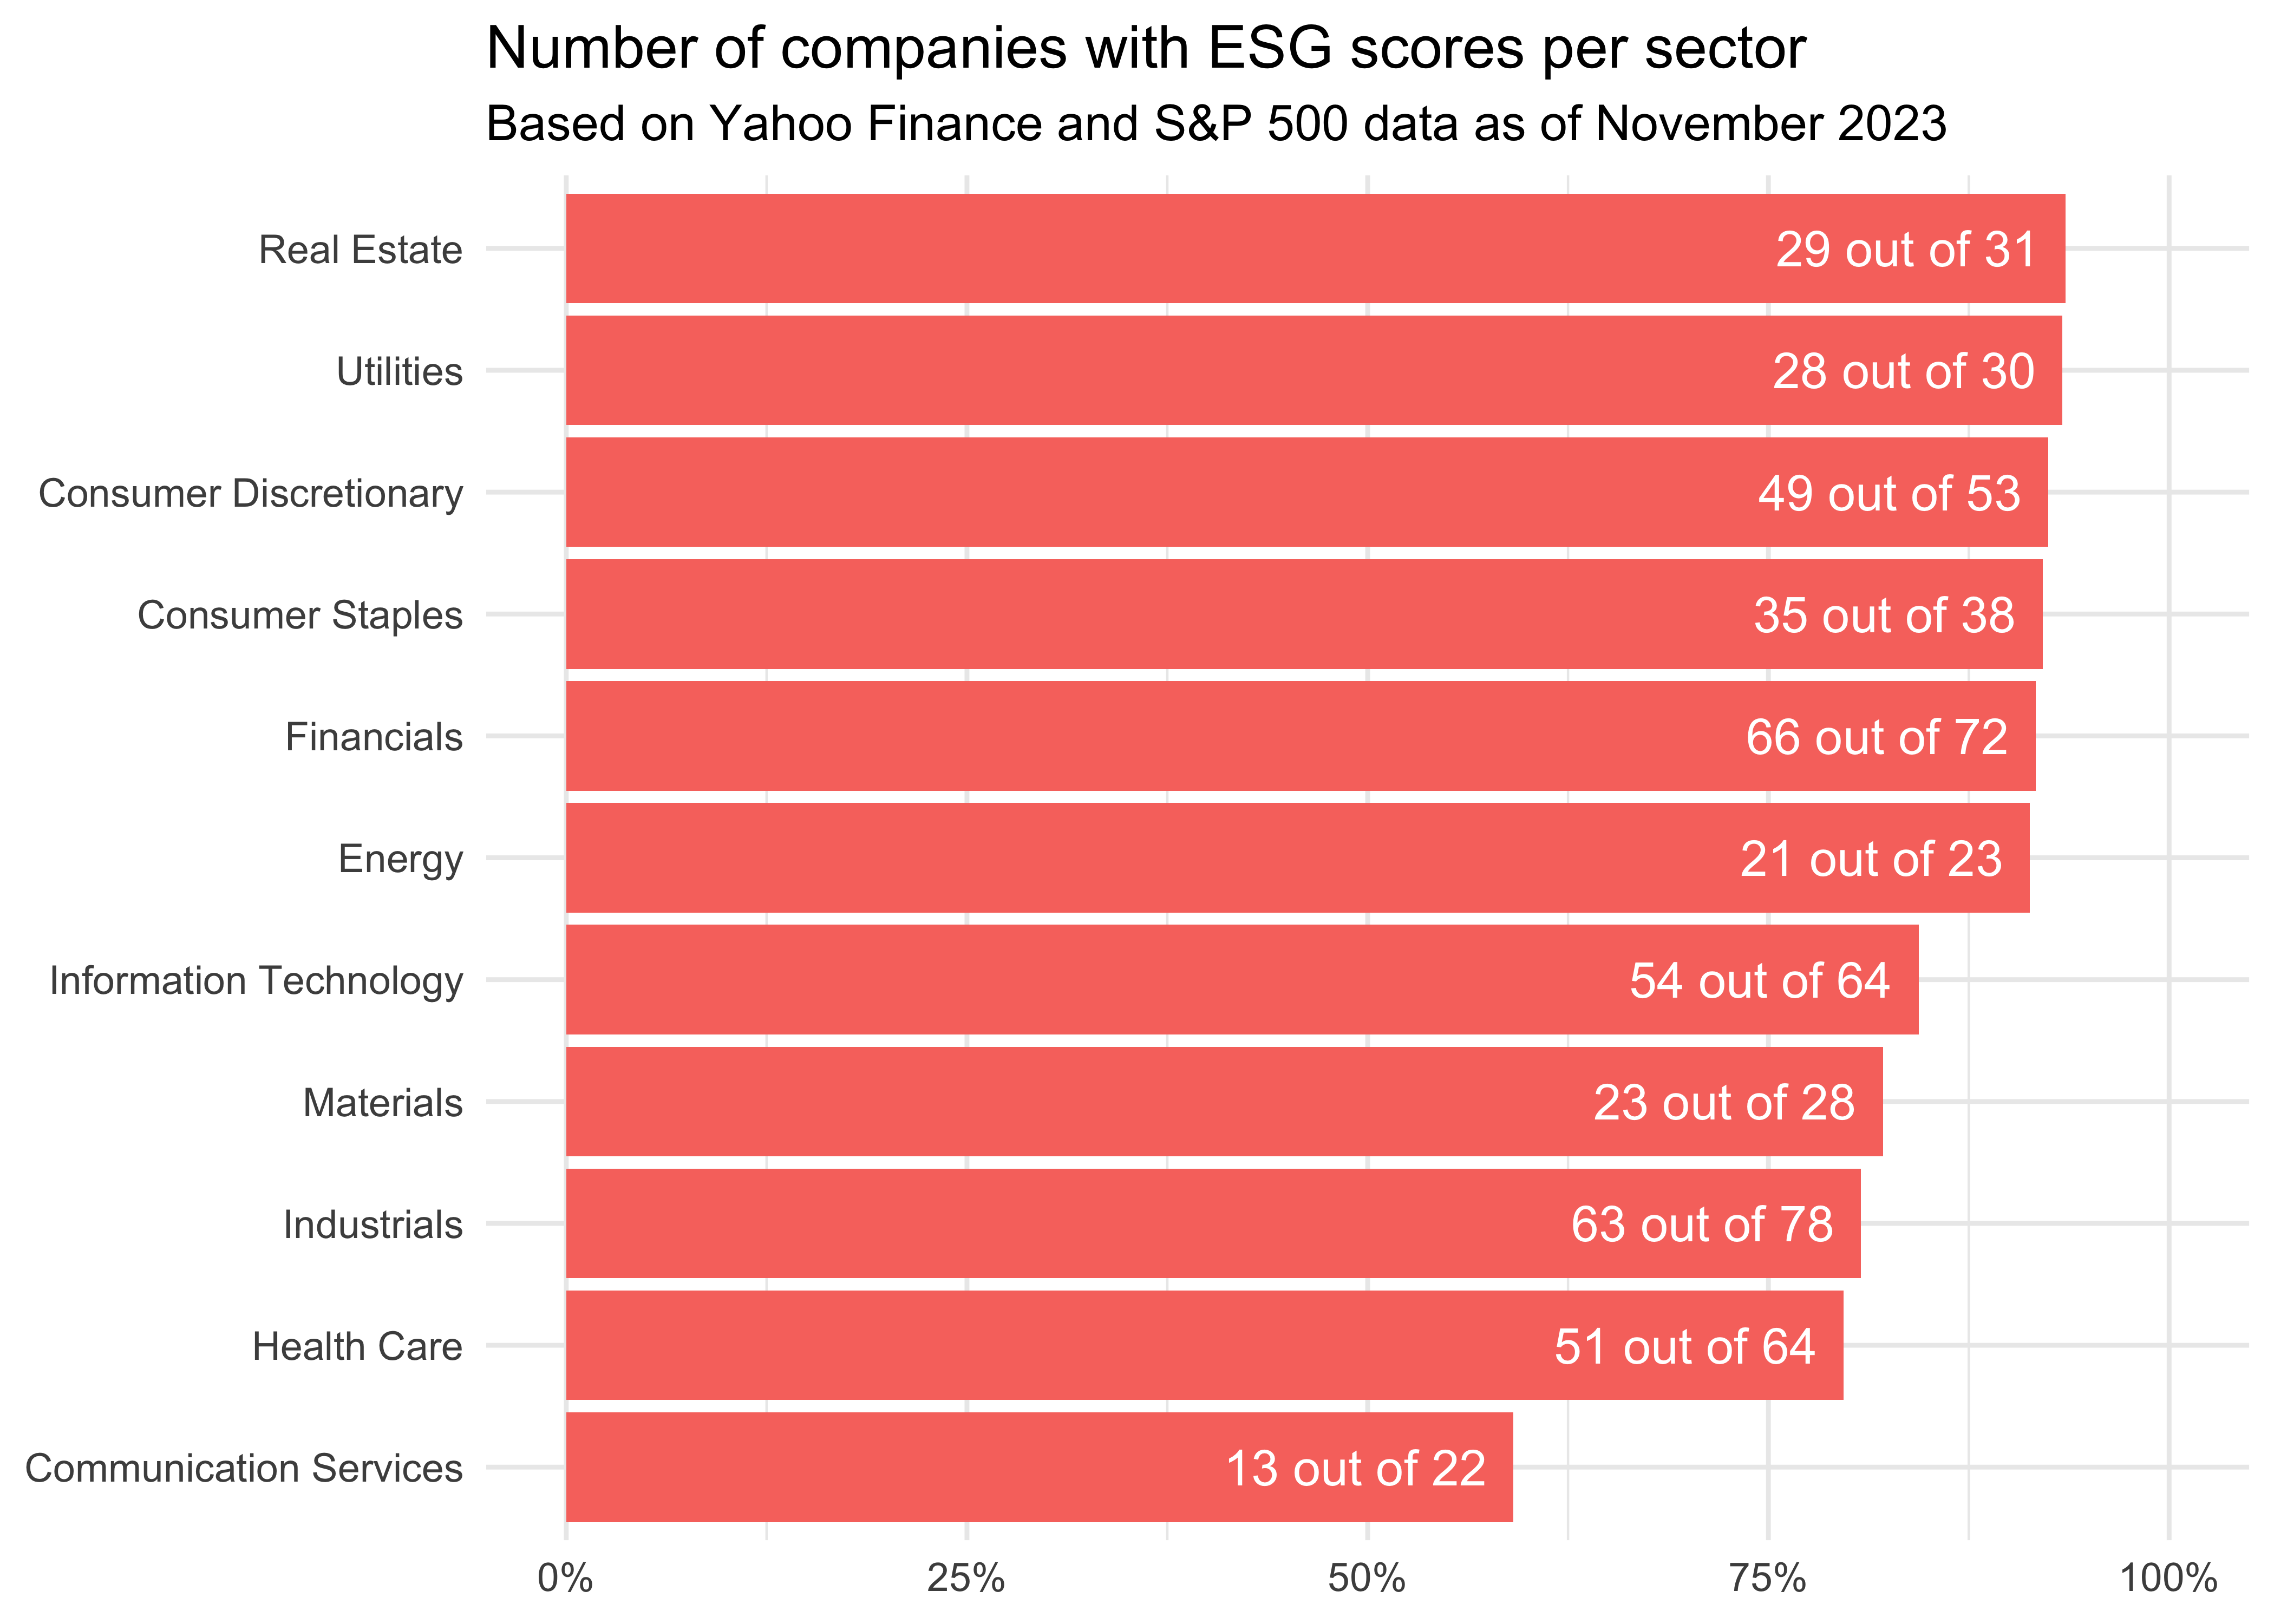
Next, I want to look at average ESG scores by sector. For instance, the real estate sector has the lowest total ESG score, indicating the lowest degree to which a sector’s business value is at risk driven by environmental, social and governance risks. Financials exhibit the the lowest environmental risk, while the energy sector (at least the part included in the S&P 500) has the highest exposure to environmental risks.
esg_scores_sector|>
  pivot_longer(cols = contains("score"))|>
  mutate(name = str_to_title(str_replace_all(name, "_", " ")),
         name = factor(name),
         sector = tidytext::reorder_within(sector, -value, name))|>
  ggplot(aes(y = sector, x = value, fill = name)) +
  geom_col(show.legend = FALSE) +
  facet_wrap(~name, scales = "free_y") +
  theme_minimal() +
  tidytext::scale_y_reordered() +
  geom_text(aes(label = round(value, 0)), hjust = 1.1, color = "white") +
  labs(y = NULL, x = NULL,
       title = "Average ESG scores per sector",
       subtitle = "Based on Yahoo Finance and S&P 500 data as of November 2023")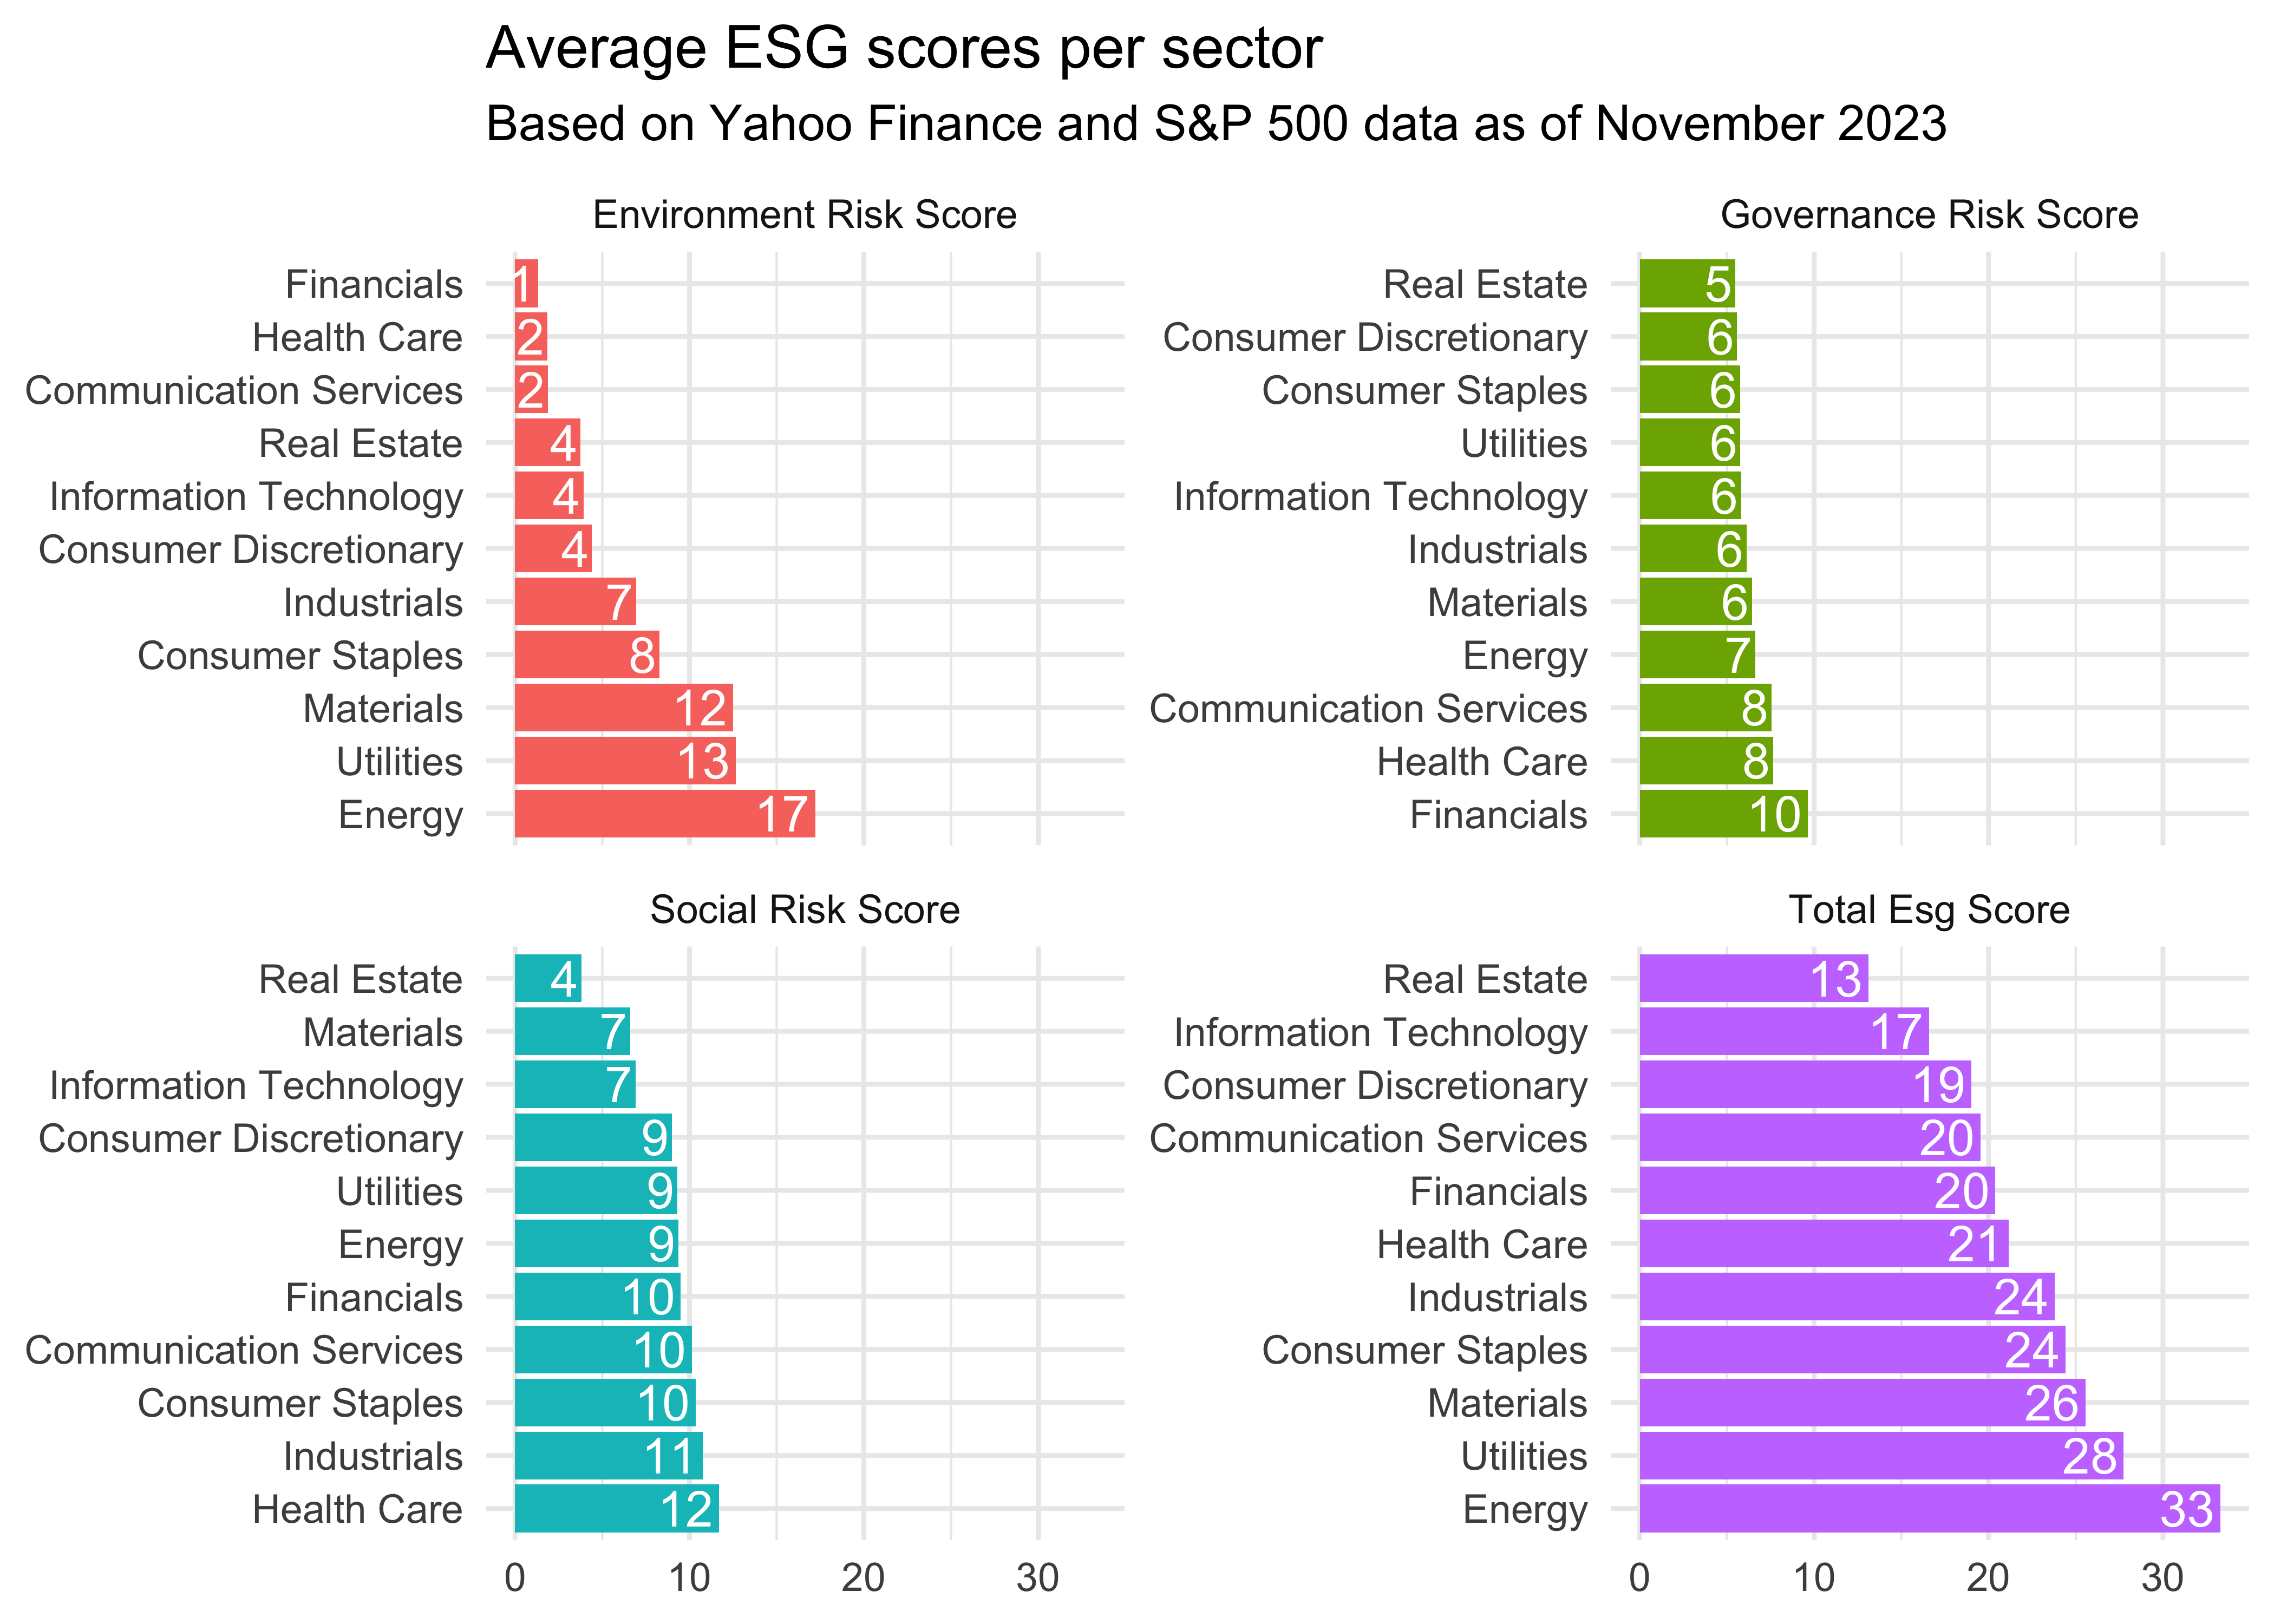
Finally, I am also interested in the average controversy level which measures to which degree companies are involved in incidents and events that may negatively impact stakeholders, the environment or their operations. I decided to plot the controversy of each sector relative to the average overall controversy. Real estate and information technology seem to be far less controverse than consumer staples and communication services.
esg_scores_sector|>
  mutate(controversy_relative = controversy_level - mean(controversy_level)) |>
  ggplot(aes(y = reorder(sector, -controversy_relative),
             x = controversy_relative, fill = (controversy_relative < 0))) +
  geom_bar(stat = "identity", position = "dodge") +
  theme_minimal() + theme(legend.position = "none") +
  coord_cartesian(xlim = c(-1.5, 1.5)) +
  labs(y = NULL, x = NULL,
       title = "Average sector-level controversy relative to overall controversy",
       subtitle = "Based on Yahoo Finance and S&P 500 data as of November 2023")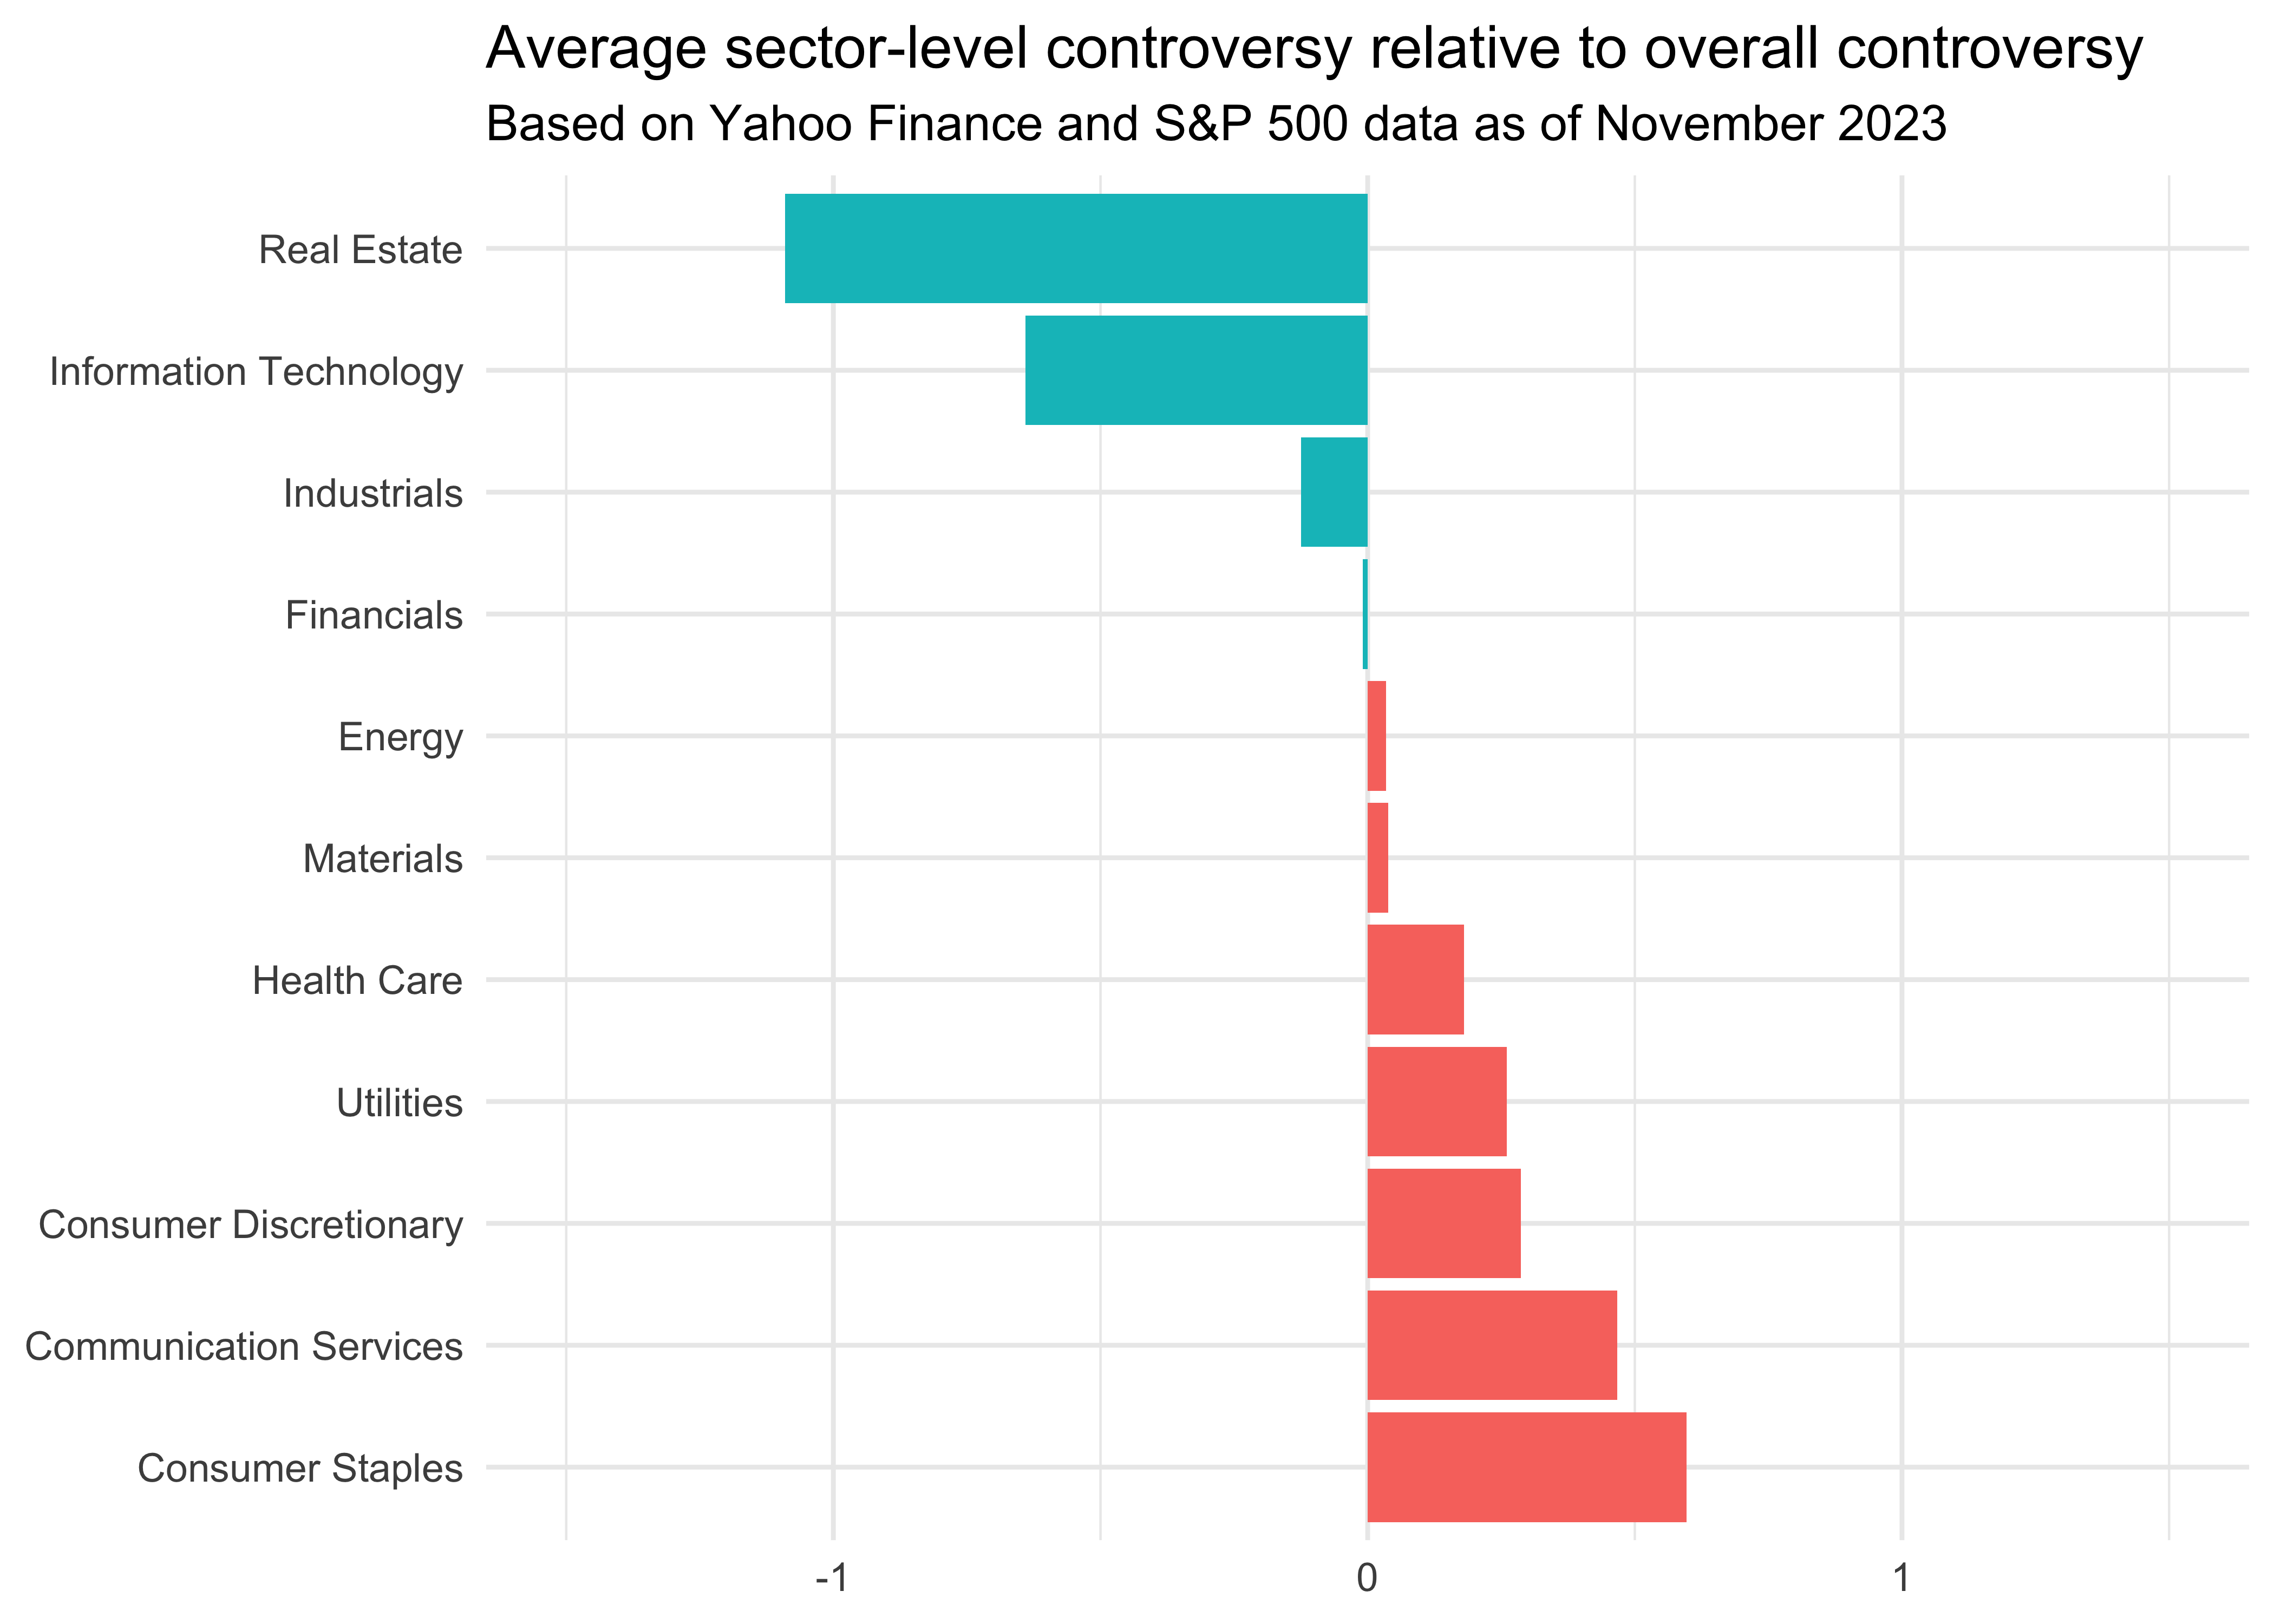
I think there is a lot more interesting stuff to uncover using the ESG scores, but for now I’ll leave it at that. I am nonetheless surprised, how easy scraping information from websites is using these amazing packages.